268 CHAPTER 12. POLAR COORDINATES
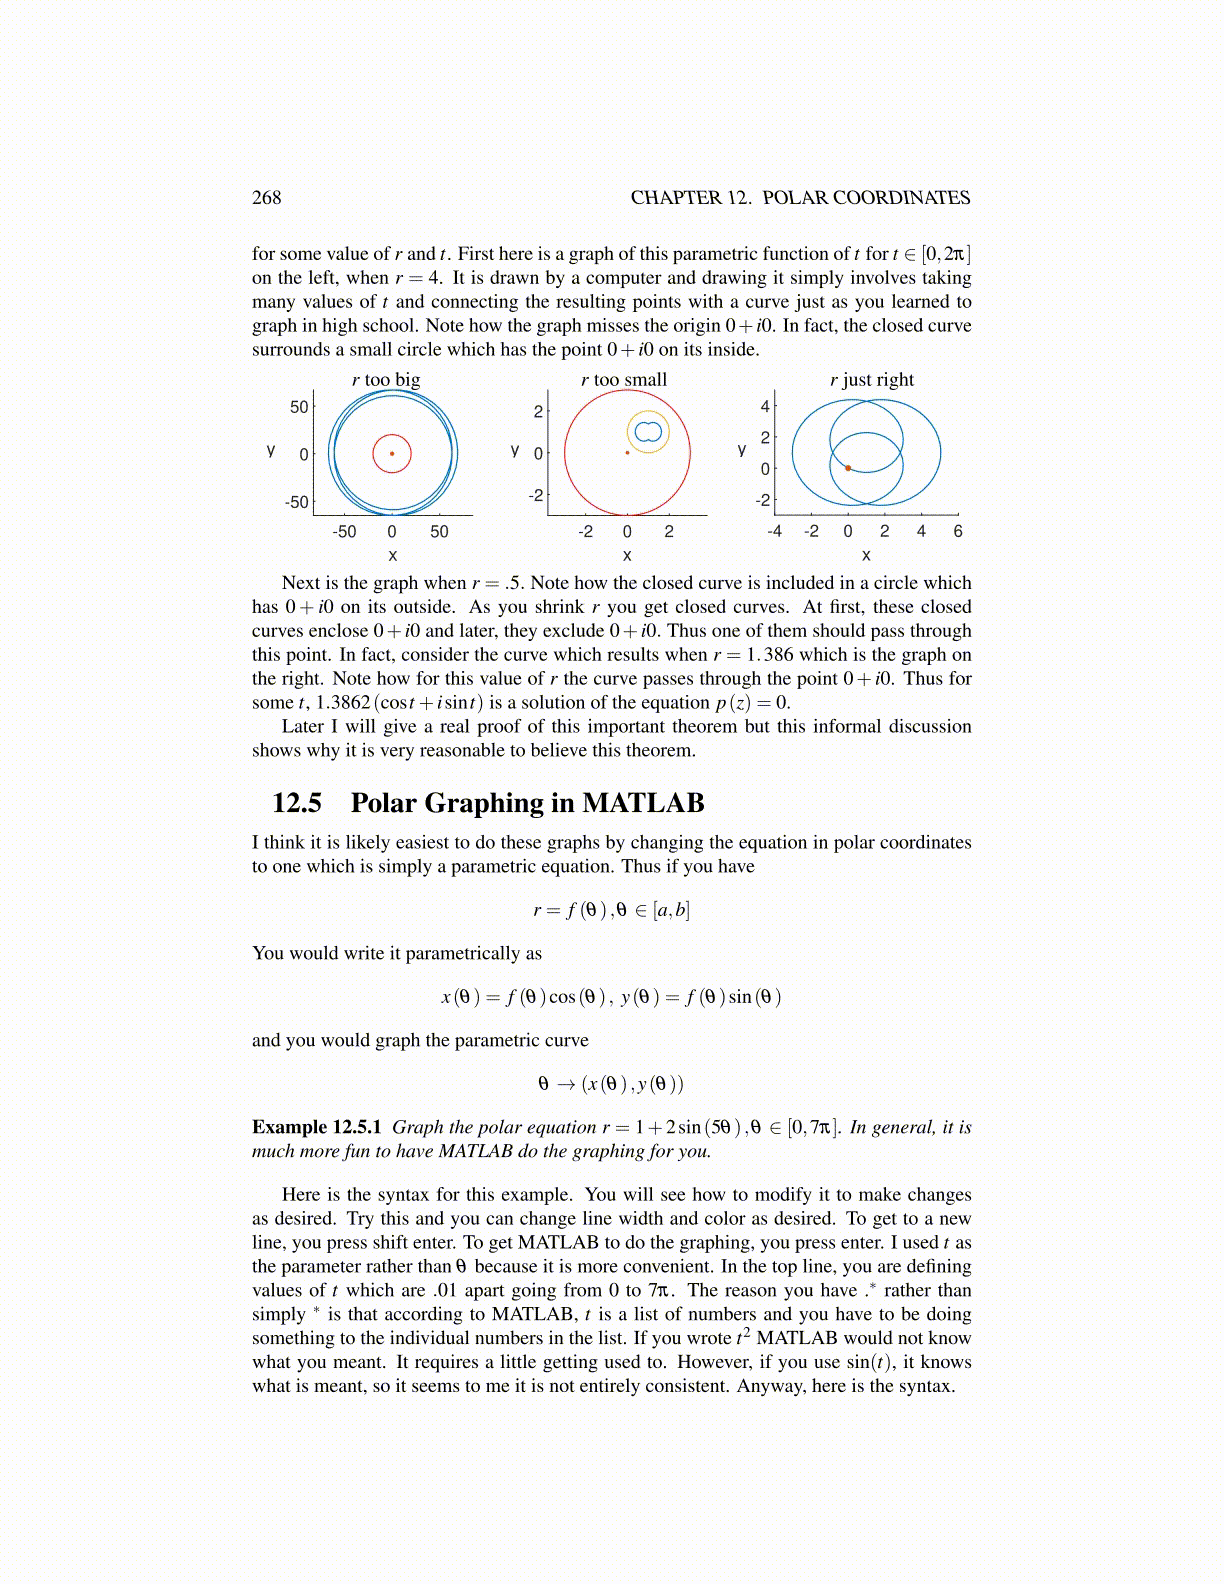
for some value of r and t. First here is a graph of this parametric function of t for t ∈ [0,2π]on the left, when r = 4. It is drawn by a computer and drawing it simply involves takingmany values of t and connecting the resulting points with a curve just as you learned tograph in high school. Note how the graph misses the origin 0+ i0. In fact, the closed curvesurrounds a small circle which has the point 0+ i0 on its inside.
-50 0 50
x
-50
0
50
y
-2 0 2
x
-2
0
2
y
-4 -2 0 2 4 6
x
-2
0
2
4
y
r too big r too small r just right
Next is the graph when r = .5. Note how the closed curve is included in a circle whichhas 0+ i0 on its outside. As you shrink r you get closed curves. At first, these closedcurves enclose 0+ i0 and later, they exclude 0+ i0. Thus one of them should pass throughthis point. In fact, consider the curve which results when r = 1.386 which is the graph onthe right. Note how for this value of r the curve passes through the point 0+ i0. Thus forsome t, 1.3862(cos t + isin t) is a solution of the equation p(z) = 0.
Later I will give a real proof of this important theorem but this informal discussionshows why it is very reasonable to believe this theorem.
12.5 Polar Graphing in MATLABI think it is likely easiest to do these graphs by changing the equation in polar coordinatesto one which is simply a parametric equation. Thus if you have
r = f (θ) ,θ ∈ [a,b]
You would write it parametrically as
x(θ) = f (θ)cos(θ) , y(θ) = f (θ)sin(θ)
and you would graph the parametric curve
θ → (x(θ) ,y(θ))
Example 12.5.1 Graph the polar equation r = 1+2sin(5θ) ,θ ∈ [0,7π]. In general, it ismuch more fun to have MATLAB do the graphing for you.
Here is the syntax for this example. You will see how to modify it to make changesas desired. Try this and you can change line width and color as desired. To get to a newline, you press shift enter. To get MATLAB to do the graphing, you press enter. I used t asthe parameter rather than θ because it is more convenient. In the top line, you are definingvalues of t which are .01 apart going from 0 to 7π . The reason you have .∗ rather thansimply ∗ is that according to MATLAB, t is a list of numbers and you have to be doingsomething to the individual numbers in the list. If you wrote t2 MATLAB would not knowwhat you meant. It requires a little getting used to. However, if you use sin(t), it knowswhat is meant, so it seems to me it is not entirely consistent. Anyway, here is the syntax.