320 CHAPTER 15. SEQUENCES, COMPACTNESS, CONTINUITY
velocity of a fluid at the point (x,y), the picture of these arrows can give an idea of themotion of the fluid. When they are long the fluid is moving fast, when they are short, thefluid is moving slowly. The direction of these arrows is an indication of the direction ofmotion. The only sensible way to produce such a picture is with a computer. Otherwise,it becomes a worthless exercise in busy work. Furthermore, it is of limited usefulness inthree dimensions because in three dimensions such pictures are too cluttered to conveymuch insight.
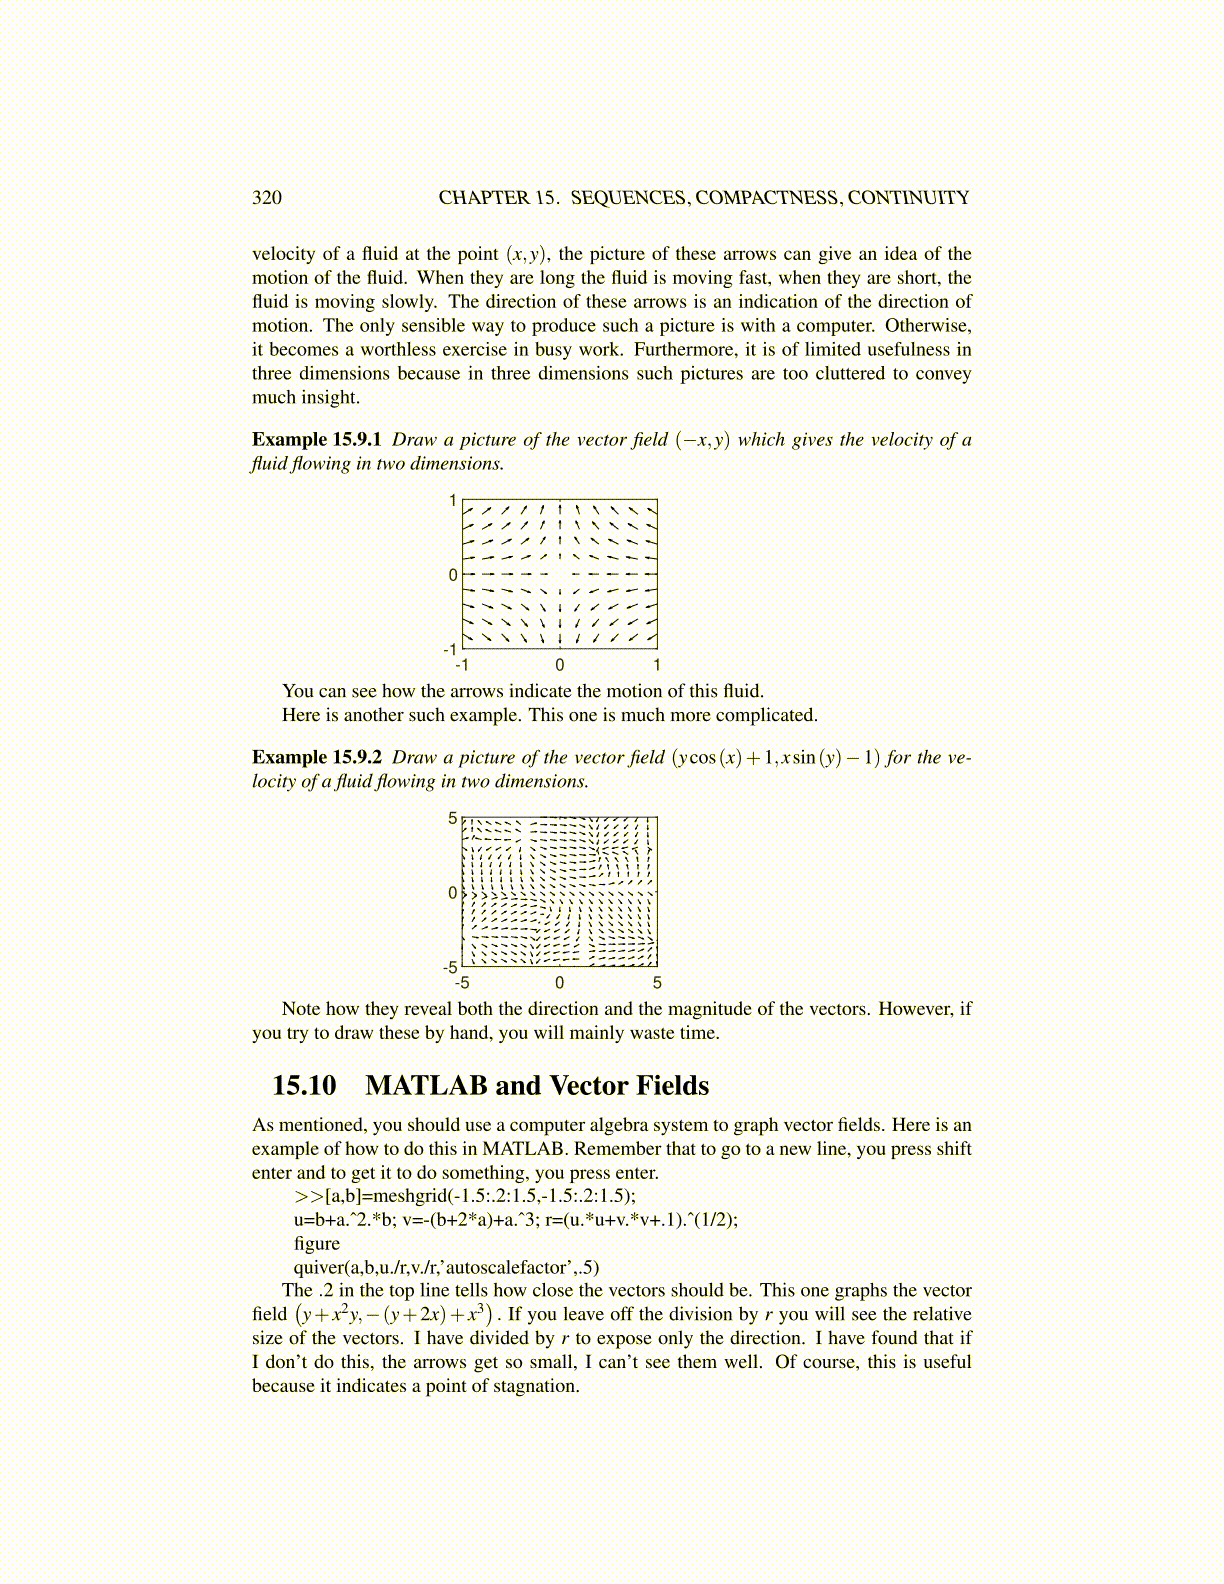
Example 15.9.1 Draw a picture of the vector field (−x,y) which gives the velocity of afluid flowing in two dimensions.
-1 0 1-1
0
1
You can see how the arrows indicate the motion of this fluid.Here is another such example. This one is much more complicated.
Example 15.9.2 Draw a picture of the vector field (ycos(x)+1,xsin(y)−1) for the ve-locity of a fluid flowing in two dimensions.
-5 0 5-5
0
5
Note how they reveal both the direction and the magnitude of the vectors. However, ifyou try to draw these by hand, you will mainly waste time.
15.10 MATLAB and Vector FieldsAs mentioned, you should use a computer algebra system to graph vector fields. Here is anexample of how to do this in MATLAB. Remember that to go to a new line, you press shiftenter and to get it to do something, you press enter.
>>[a,b]=meshgrid(-1.5:.2:1.5,-1.5:.2:1.5);u=b+a.ˆ2.*b; v=-(b+2*a)+a.ˆ3; r=(u.*u+v.*v+.1).ˆ(1/2);figurequiver(a,b,u./r,v./r,’autoscalefactor’,.5)
The .2 in the top line tells how close the vectors should be. This one graphs the vectorfield
(y+ x2y,−(y+2x)+ x3
). If you leave off the division by r you will see the relative
size of the vectors. I have divided by r to expose only the direction. I have found that ifI don’t do this, the arrows get so small, I can’t see them well. Of course, this is usefulbecause it indicates a point of stagnation.