Chapter 16
Space CurvesA vector valued function of one variable t traces out a curve in space. Given values of tresult in various points. The resulting set of points is called a space curve. The functionused to describe this set of points is called a parametrization. The curve itself is called aparametric curve.
16.1 Using MATLAB to Graph Space CurvesIt is useful and fun to graph parametric curves if you use something like MATLAB to dothe hard work. I will show you the syntax with an example.
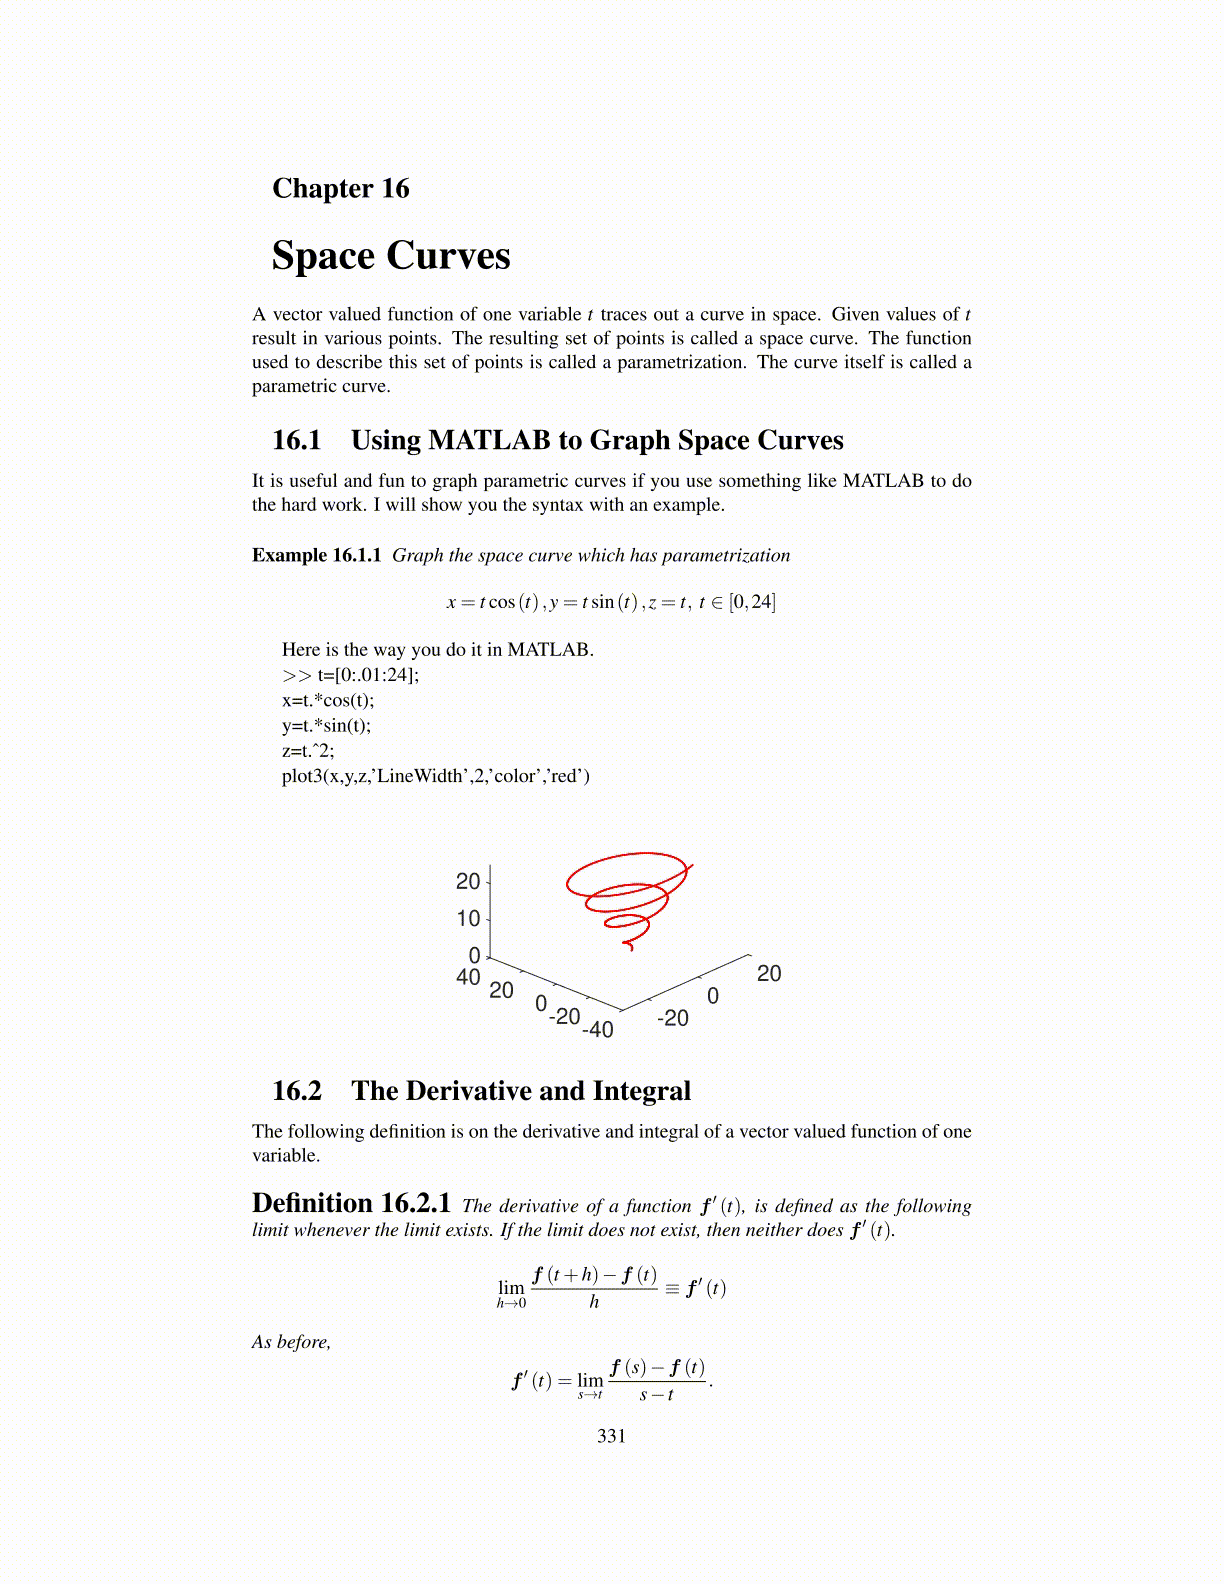
Example 16.1.1 Graph the space curve which has parametrization
x = t cos(t) ,y = t sin(t) ,z = t, t ∈ [0,24]
Here is the way you do it in MATLAB.>> t=[0:.01:24];x=t.*cos(t);y=t.*sin(t);z=t.ˆ2;plot3(x,y,z,’LineWidth’,2,’color’,’red’)
02040
20
10
00-20 -20
20
-40
16.2 The Derivative and IntegralThe following definition is on the derivative and integral of a vector valued function of onevariable.
Definition 16.2.1 The derivative of a function f ′ (t), is defined as the followinglimit whenever the limit exists. If the limit does not exist, then neither does f ′ (t).
limh→0
f (t +h)−f (t)h
≡ f ′ (t)
As before,
f ′ (t) = lims→t
f (s)−f (t)s− t
.
331